

Owner Operator Insurance Cost Per Month: 2026 Report
From January to May 2026, our research team analyzed owner operator insurance costs from programs across all 50 states, drawing on carrier quoting benchmarks, submissions from multiple insurance providers, and the American Transportation Research Institute’s (ATRI) Operational Costs of Trucking report. Owner operator insurance costs between $250 and $2,083 per month in 2026, depending on authority status, operating radius, cargo type, and driving history. Operators are organized into four tiers: new authorities (under 12 months), growing authorities (1 to 2 years), established authorities (3 or more years), and operators leased to a motor carrier. Where carrier-specific data required modeling, ranges are labeled as estimates. The primary benchmarking table below provides a full monthly cost breakdown by operator type.
Owner Operator Insurance Cost Per Month by Operator Type: 2026
Authority status is the single largest driver of monthly insurance costs for owner operators. The table below shows average monthly and annual cost ranges for each operator tier, along with the primary factor shaping costs at each level.

The data indicate that authority status is the single largest cost variable in owner-operator insurance. New authorities pay up to 400% more per month than operators leased to a motor carrier, and 60% to 80% more than established operators with 3 or more years of clean history. Most owner operators see rates fall 15% to 25% after their first year and continue improving through year three, when access to preferred carriers typically becomes available. The gap between leased operators and independent authorities reflects a structural difference in coverage responsibility. Leased operators rely on the motor carrier’s primary liability and cargo coverage, reducing their own monthly insurance spend to bobtail or non-trucking liability, physical damage, and occupational accident coverage only.
Owner Operator Insurance Cost Per Month by Coverage Type: 2026
A full owner-operator program under independent authority typically includes several coverage layers. The table below shows monthly and annual cost ranges for each coverage type, along with when carriers, shippers, or lenders require it.

The data shows that primary auto liability accounts for the majority of monthly insurance spend for independent authority operators, typically representing 55% to 70% of total monthly program cost at $417 to $833 or more per month. Nuclear verdicts against trucking companies rose 52% in 2024, with average awards reaching $27.5 million between June 2020 and April 2023, and this trend has driven primary liability costs higher each year. Leased operators carry a meaningfully different cost profile. Their primary liability is covered by the motor carrier, so their monthly spend typically concentrates on bobtail or non-trucking liability ($29 to $40 per month), physical damage ($83 to $250 per month), and occupational accident coverage ($133 to $183 per month).
Owner Operator Insurance Cost Per Month by State: 2026
State of domicile and primary operating region have a significant impact on monthly owner operator insurance costs. The table below shows average annual local premium rates and their monthly equivalents for all 50 states, ranked from most to least affordable. Operators running interstate long-haul routes typically pay 30% to 50% above local benchmarks due to multi-state exposure and higher liability limits required by freight brokers.
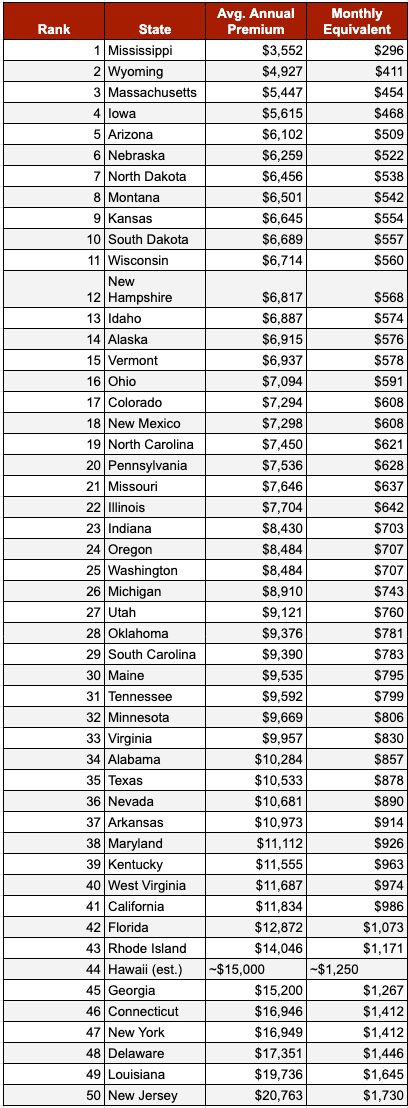
The data reveals that state of domicile can shift monthly insurance costs by more than $1,400. An owner operator based in Mississippi pays an estimated $296 per month at the local premium benchmark, while one based in New Jersey pays $1,730. The Midwest continues to offer the most favorable rate environments in the country, with six of the top 15 most affordable states located in that region. The most expensive states share a consistent pattern: dense urban corridors, high claim severity, and active plaintiff litigation environments. New Jersey, Louisiana, Delaware, New York, and Connecticut round out the five most costly states for owner operators in 2026.
Owner Operator Insurance Rate Trends: 2019 to 2025
Owner operator insurance costs have risen steadily since 2019 and hit a record high in 2024. The table below shows estimated industry-wide insurance cost per mile for commercial trucking operations, based on ATRI operational cost data and carrier rate filings. The 2025 figure is a modeled estimate based on early-year rate filings and reported market conditions.

The data indicates that insurance costs per mile rose an estimated 43% from 2019 to 2025, with increases remaining gradual through 2023 before accelerating sharply in 2024. ATRI confirmed the 2024 record of $0.102 per mile in its most recent operational cost report and noted that trucking auto liability premiums rose 36% per mile over the prior eight years. The 2024 spike of 12.1% was the steepest single-year increase in this dataset, driven by a 52% surge in nuclear verdicts and a 14.9% jump in physical damage coverage costs, the highest physical damage increase across all major commercial insurance lines that year. Despite accident rates declining over the past four years, premiums kept climbing. ATRI attributes this to litigation behavior, including aggressive plaintiff attorney tactics and the rise of litigation funding, which has created a persistent gap between actual crash data and insurance pricing and pushed many carriers to reduce capacity in commercial trucking.
Conclusion
The findings from this dataset point to a consistent theme: owner-operator insurance costs in 2026 are shaped by a combination of factors that compound each other. Authority age, state of operation, coverage structure, and the broader litigation environment all influence what an operator pays each month. Understanding where your program stands relative to these benchmarks is a useful starting point for evaluating coverage options at renewal.
Get a quote here.
Sources
-
Truck Writers Research Study. Author: Truck Writers. Blaine, MN. June 2026.
-
AtoB. “Owner Operator Truck Insurance Cost Statistics for 2026.” February 10, 2026 (updated March 18, 2026). https://www.atob.com/blog/owner-operator-truck-insurance-cost-statistics
-
FleetGuard USA. “New Authority Truck Insurance Costs: 2026 Owner Operator Guide.” 2026. https://fleetguardusa.com/new-authority-truck-insurance-costs-owner-operator-guide/
-
Driver Advantage. “Owner Operator Semi Truck Insurance: 2026 Guide and Rates.” November 6, 2025. https://driveradvantage.com/owner-operator-insurance-guide-7-types-of-coverage-you-actually-need/
-
Geotab. “Commercial Truck Insurance Cost: Rates by State + How to Save.” August 6, 2025. https://www.geotab.com/blog/commercial-truck-insurance-cost/
-
COGO Insurance. “How Much Will Your Trucking Insurance Cost? See the National Auto Liability Insurance Premiums in All 50 States.” 2025. https://cogoinsurance.com/how-much-will-your-trucking-insurance-cost-see-the-national-auto-liability-insurance-premiums-in-all-50-states/
-
American Transportation Research Institute (ATRI). “An Analysis of the Operational Costs of Trucking: 2025 Report.” Washington, DC. 2025. https://truckingresearch.org/about-atri/atri-research/operational-costs-of-trucking/
